
It was no surprise that the ConDems won tonight’s vote in Westminster on a Bill to limit annual increases in benefits to 1%, nor was it any surprise that Labour politicians lined up to condemn this development. So far, so predictable. The bill is a testament to Osborne’s ingenuity because it is a piece of legislation that is both apparently popular and opposed by the Labour party. In the Observer, Andrew Rawnsley rather drily commented: “It should be properly described as the Welfare (Make Labour Look Like the Party for Skiving Fat Slobs) Bill.”
But this is mischievous. The TUC has done some useful work on public perception about benefits. Whereas people think over a quarter of benefit recipients are cheating, the real figure is under 1%. Even more relevant, some 60% of the people who will lose out as a result of this bill are in work. In the emotional fracas over social conscience (or lack thereof) the two questions that no-one seems to be asking are:
- why do so many in work also receive benefits?
- can the UK economy can sustain the level of benefits we now have?
Bill Jamieson, writing in the Hootsmon last week, took politicians in the UK and elsewhere to task for hoofing the debt mountains they are faced with down the road and continuing to behave as if they can continue to outbid one another with bribes to the electorate. It was an eloquent plea for sanity & courage in the face of austerity. After nailing the scale of the US debt mountain he went on:
“Here in the UK targets for debt and deficit reduction have been missed. Even with “austerity”, net debt to GDP is on course to hit 79.9 per cent of GDP in three years, and the coalition government is besieged by bitter opposition to benefit capping. All this is unfolding under the shadow of an imminent loss of the country’s Triple A credit rating”
So, is he being a big girl’s blouse or is it time for the hair shirt? Judge for yourself. In the last fifty years—since MacMillan told a booming Britain that they’d “never had it so good” there has been a ballooning of government expenditure. This is shown in Chart 1 below.
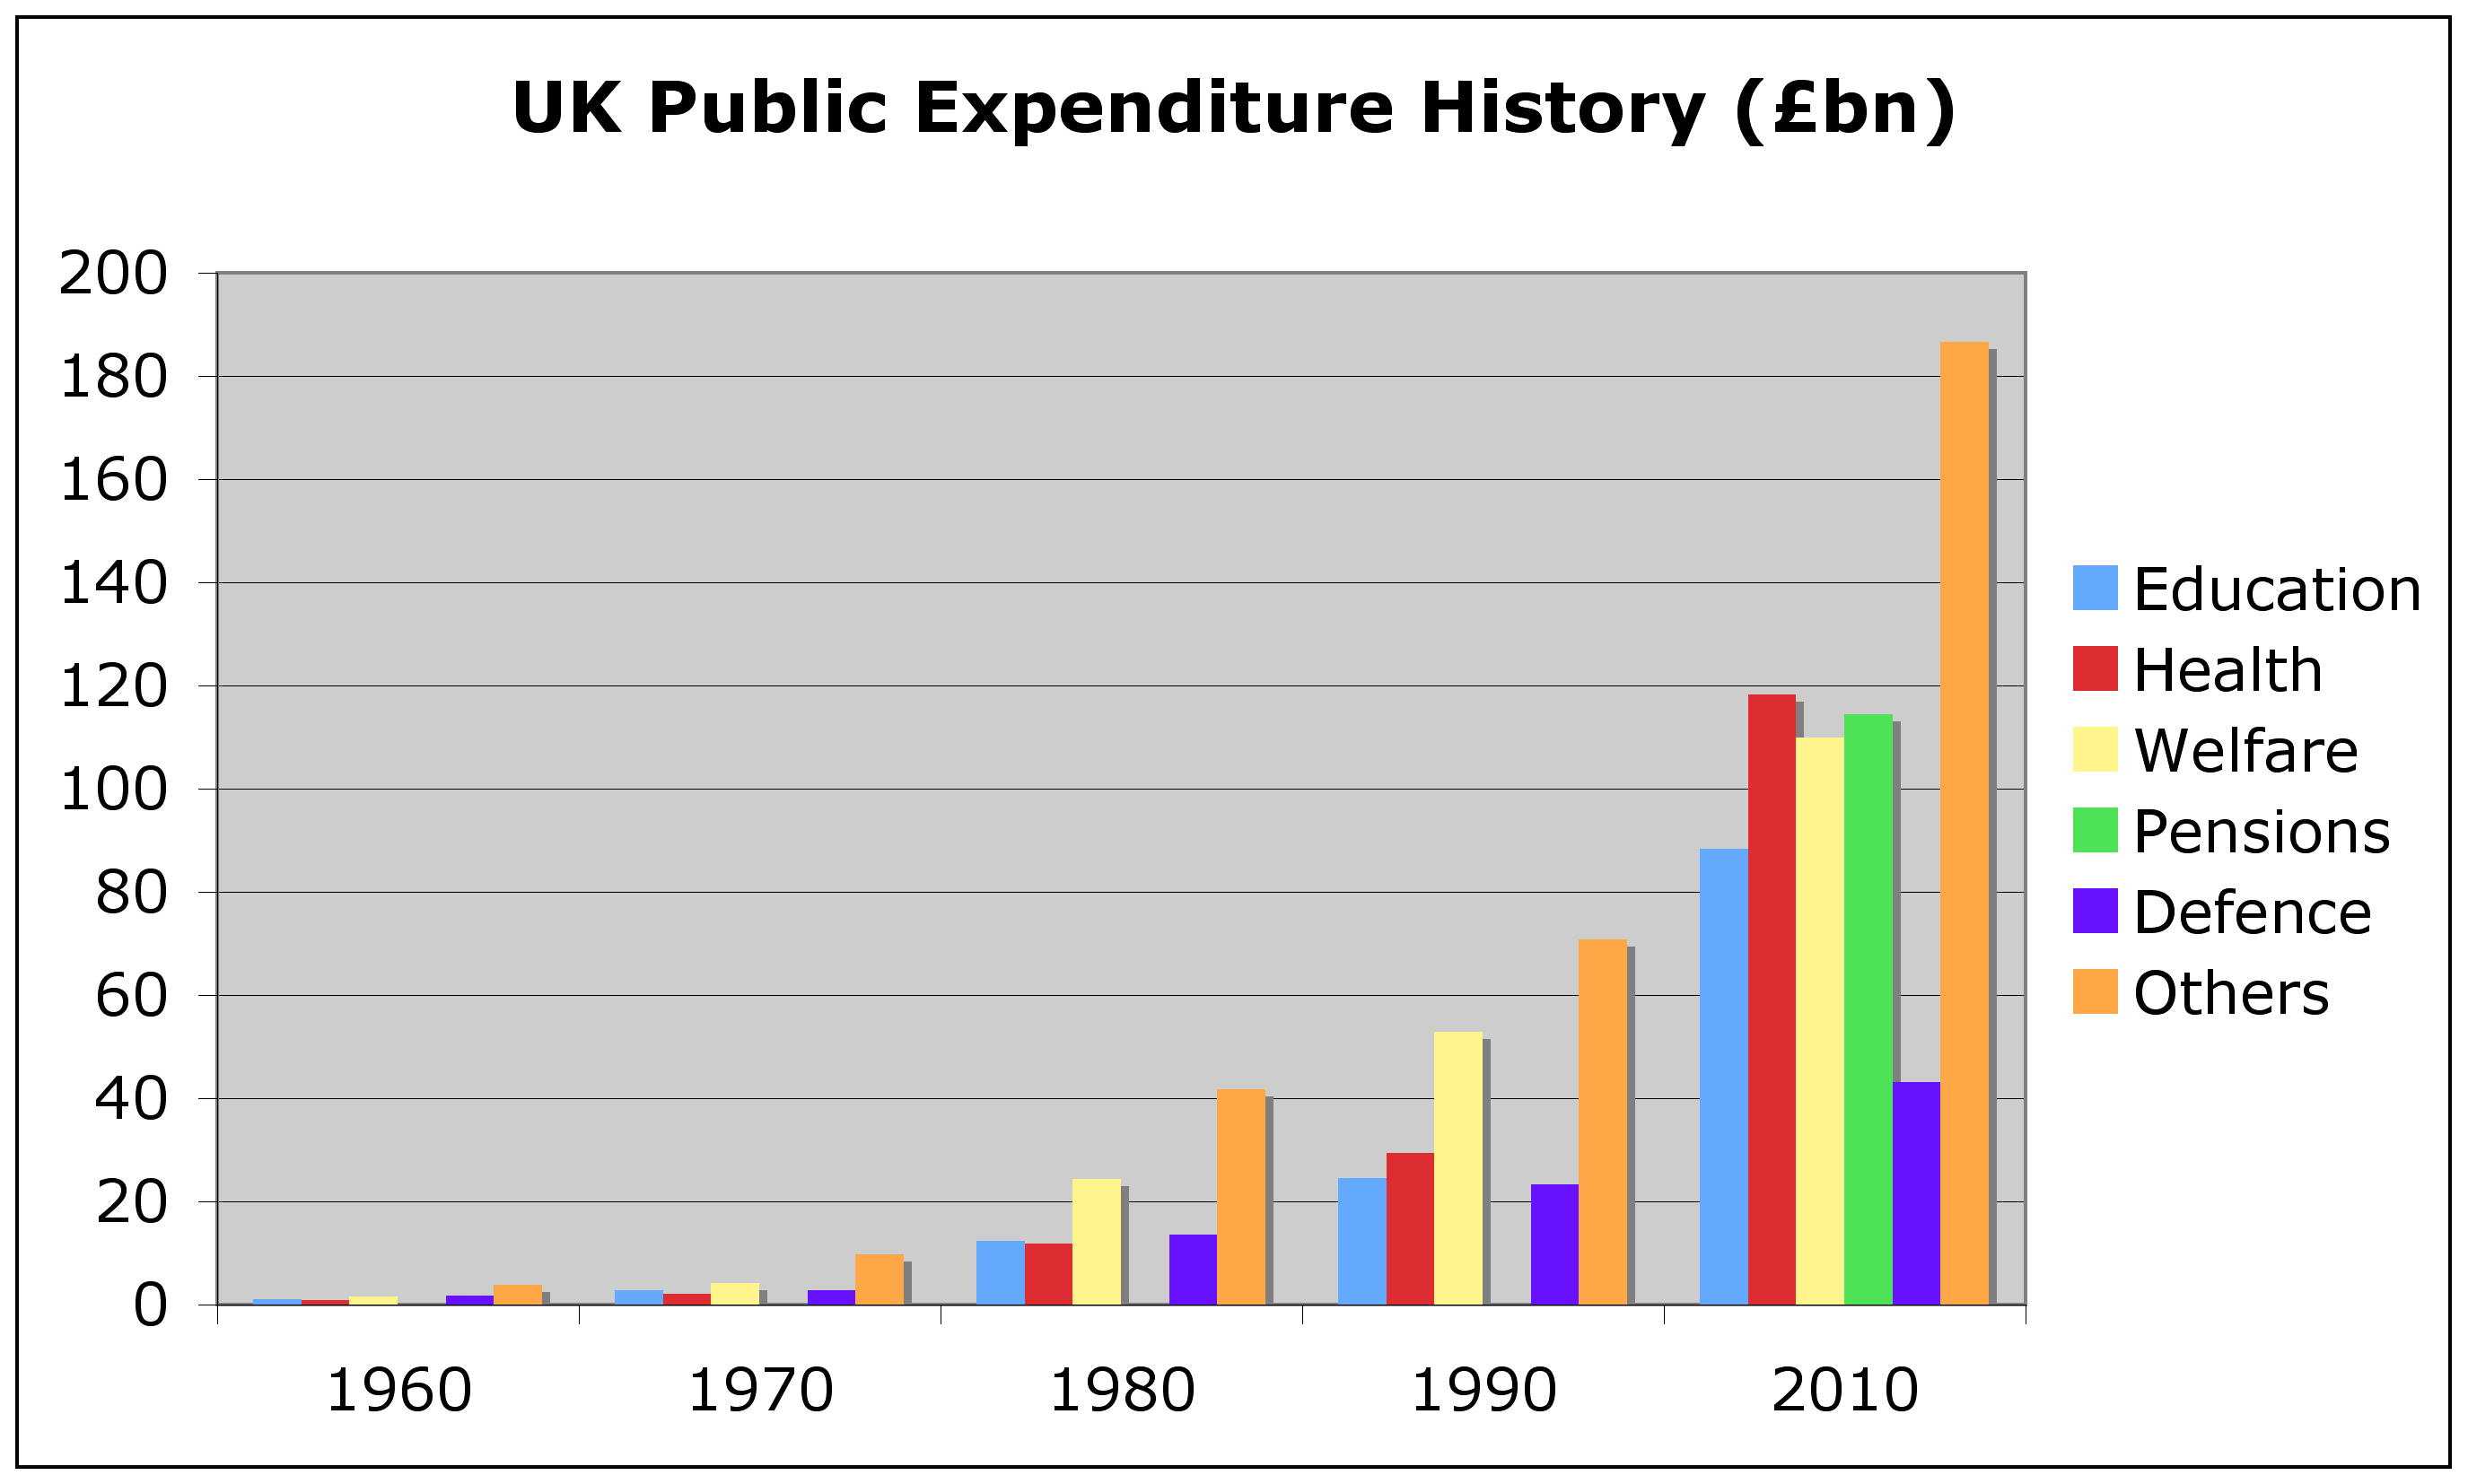
Chart 1—UK Public Expenditure per Annum in Selected Years
From a total of £9.1bn in 1960, it has mushroomed to £660bn in the first year of the present government. The chart shows the key social provisions broken out (Health, Welfare and Pensions), together with Education (a fundamental requirement) and Defence (a more optional requirement). Note that Pensions were self-funding until the last decade since when they have become 17.3% of expenditure—bigger than Education at 13.7%. In order to better compare things over time, let’s redraw the above in terms of percentages to show which have grown or diminished (Chart 2)
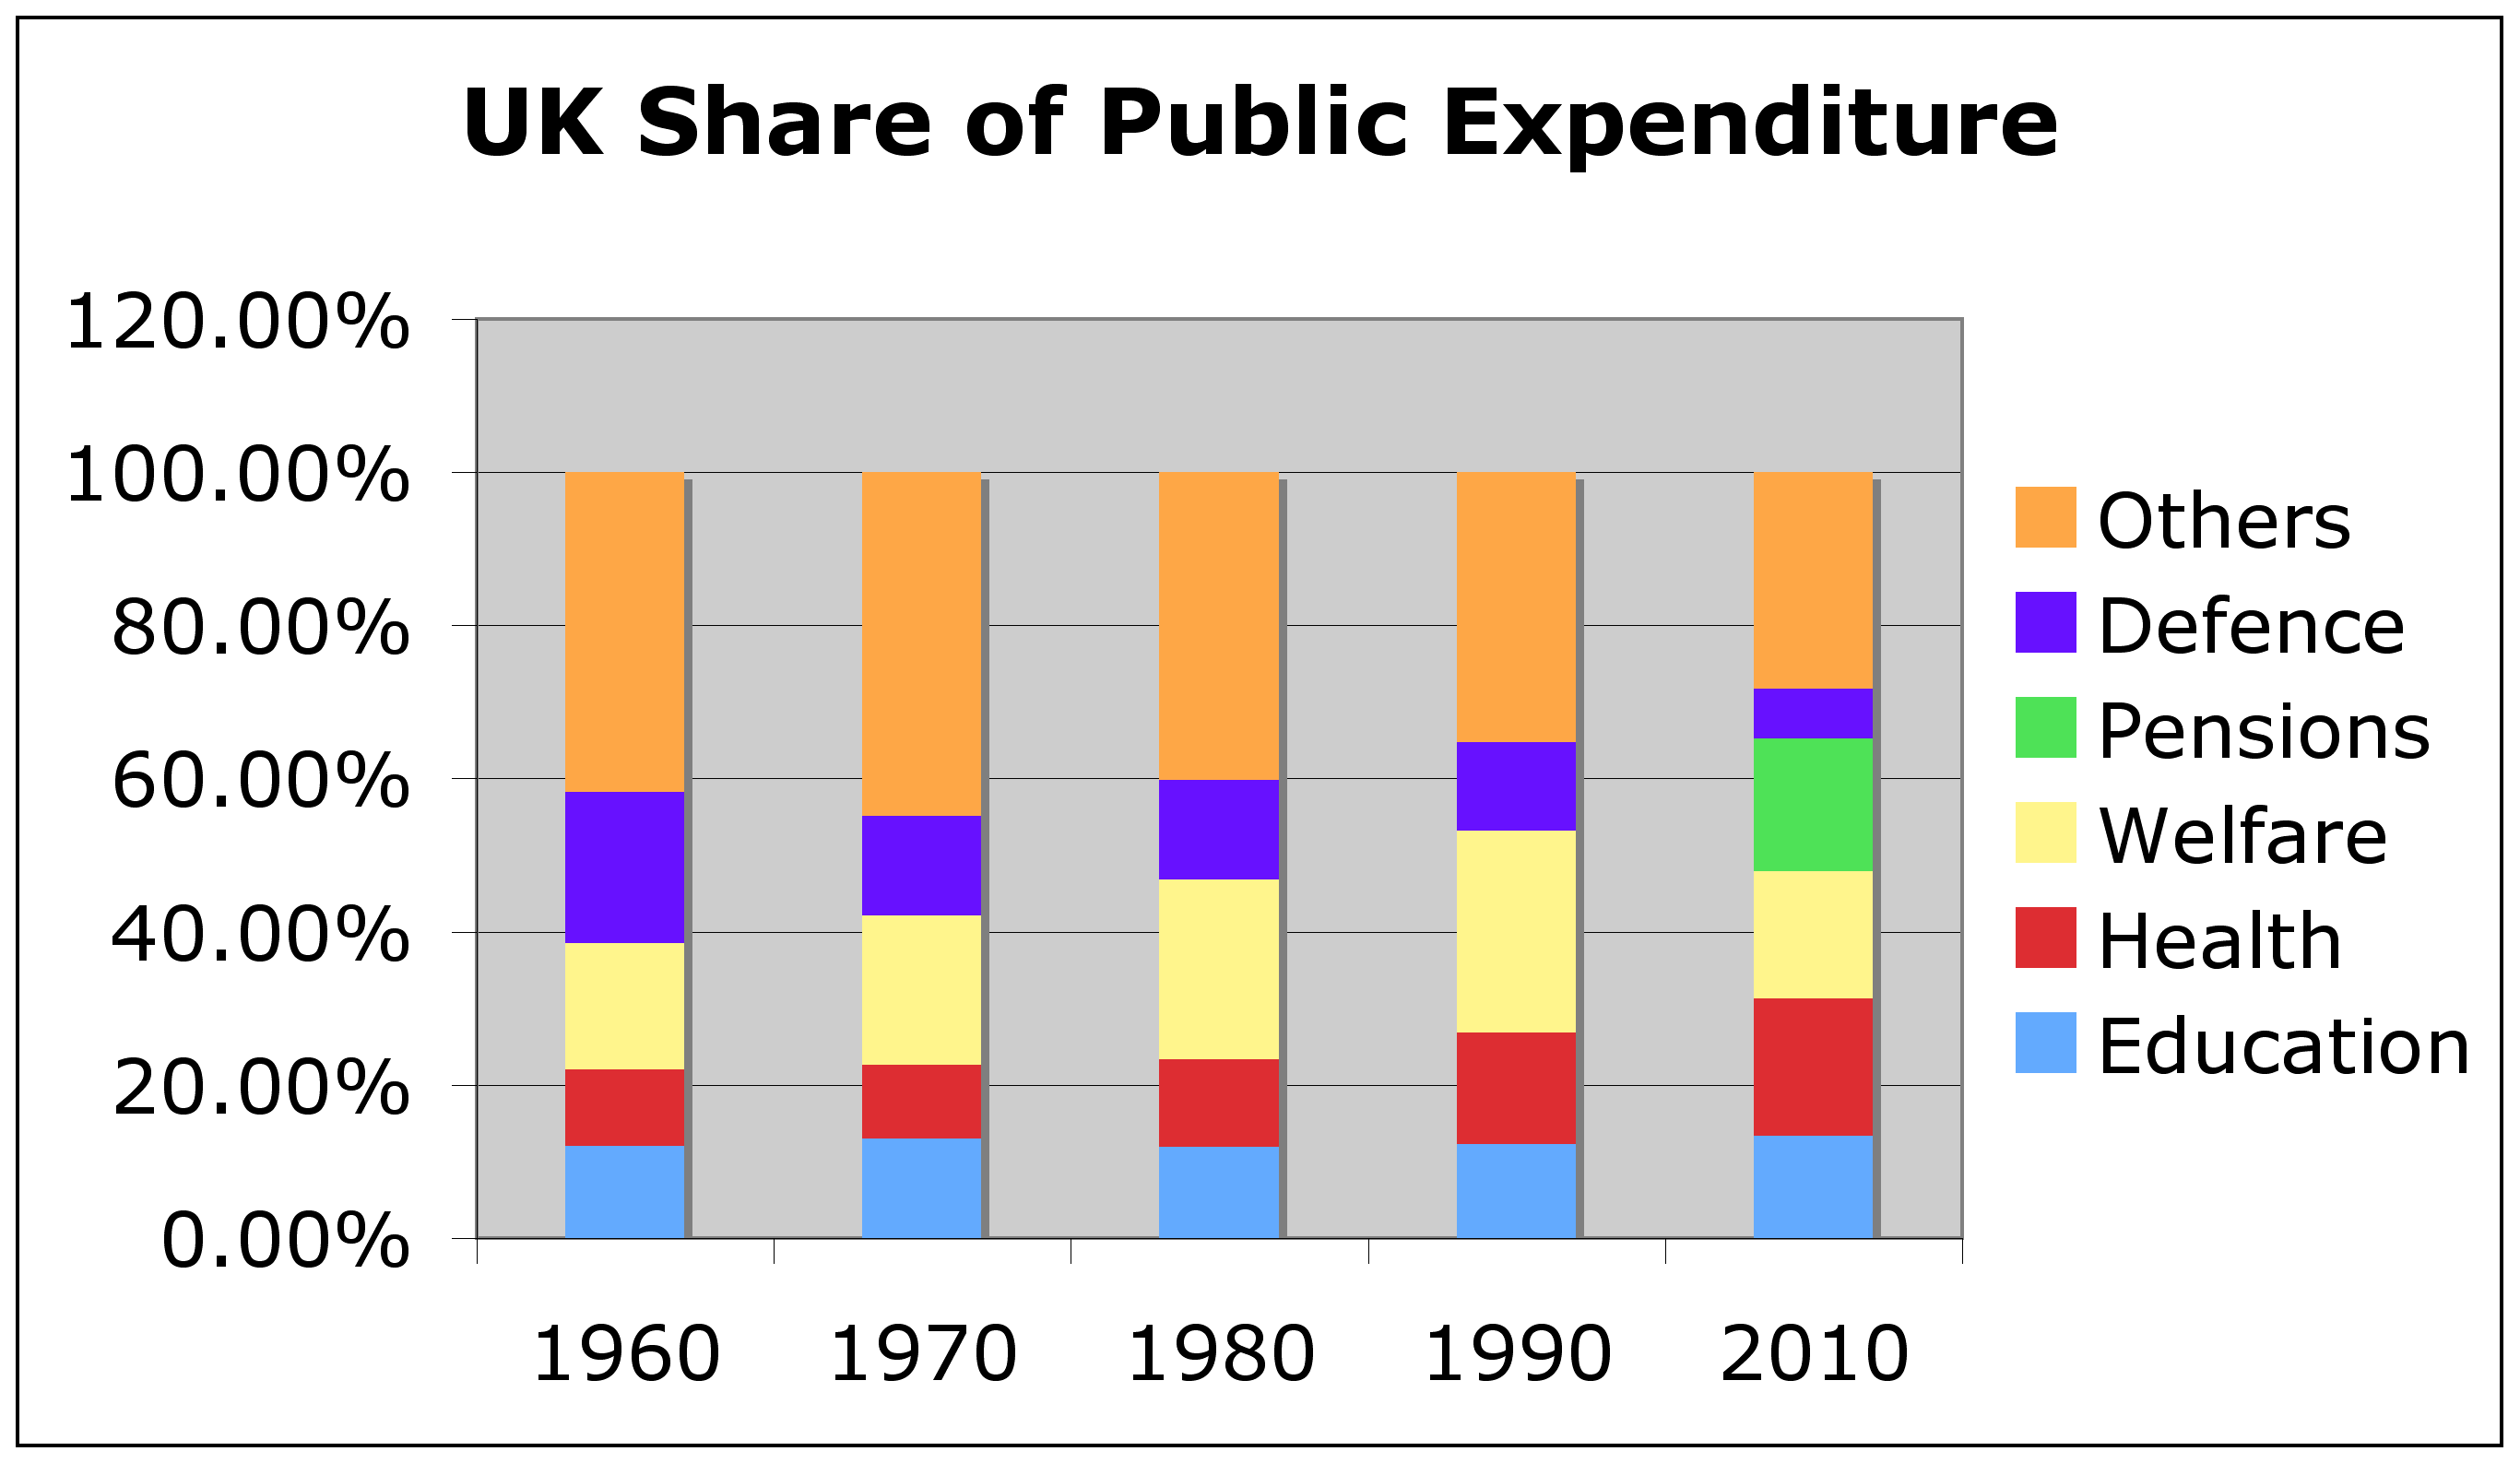
Chart 2—UK Share of Public Expenditure in Selected Years
This makes it graphically clear that ‘social’ provision has grown in fifty years from one quarter to one half of the budget. Even allowing for inflation since 1960 (1,833%), in real terms, for every £1 we once spent on health, it’s now £7.16; for every £1 on benefits and pensions, it’s £8.04.
This can be seen as laudable—a developed country looking after the welfare of its people and especially the vulnerable but let us return to the questions posed above.
“Why do so many in work also receive benefits?” This question can best be answered by all those party policy wonks who have argued for generosity with certain sections of the public—from cutting the once-punitive 90% supertax at one end to providing a minimum wage at the other. Some of the argument for those in work receiving benefits is to avoid the financial trap of those on low wages who would actually be worse off if all benefits were withdrawn.
By capping the benefit rise at 1%, about seven million working people will be affected. This is about one quarter of the UK working population. Outside of this group are the 13% of the UK population who live on disability benefit (in Japan, it is 3%). Add in the 8% unemployed (and seeking work) and rummage for the others not seeking work who are below the radar and it is perhaps not surprising that YouGov recently found 74% of people believed that the present benefits system was excessive.
“Can the UK economy can sustain the level of benefits we now have?” Because of the emotive nature of the first question, people get stuck on it seldom get around to addressing the second. It is a measure of democracy just how responsive a government is to the needs of the people. But even a democratically elected government must act decisively and can’t consult with the people through a referendum on any but the most important issues. The ConDems clearly think that benefits need to be curtailed; Labour, SNP and the Greens disagree. Who’s right?
Comparing the UK with other developed countries is one way of creating some kind of objective measure of this. While numbers don’t tell you everything, the level of unemployment, the health of the economy and the degree to which the burden of public debt is manageable are all related indicators to say what a country can afford. Table 1 lists a selection of European countries whose economy is some form of yardstick for the UK’s.
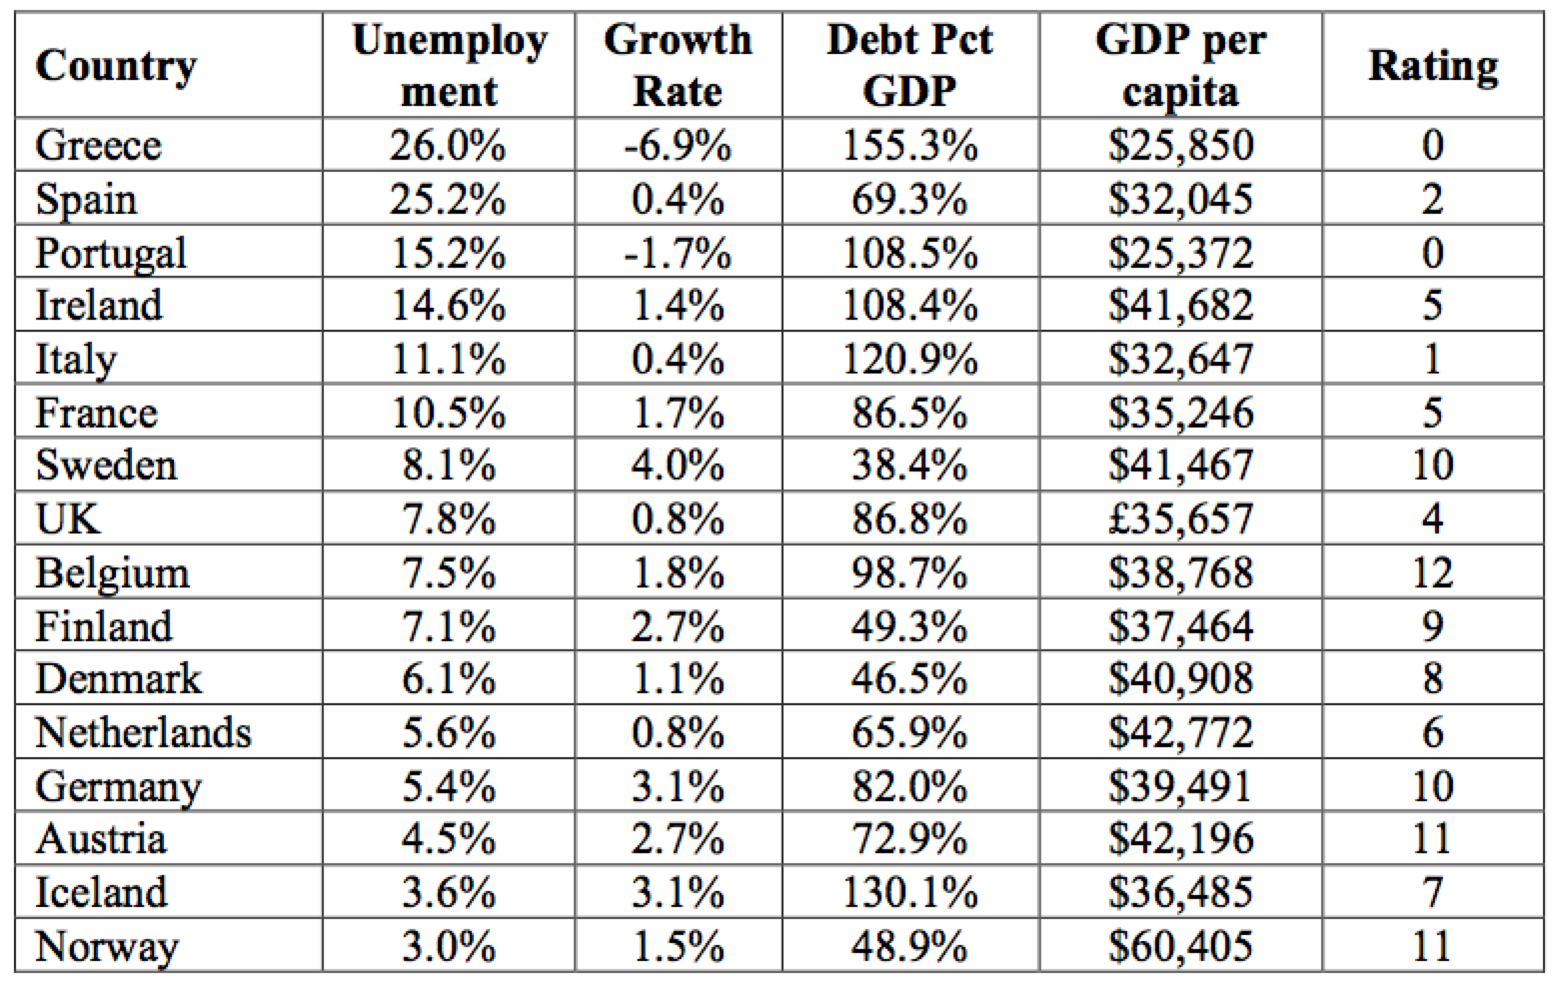
Table 1—’Scrooge Chart’ Comparison of Economic Parameters among 16 European Countries
All of Britain’s neighbours and several other comparable European countries are rated in the above table by considering which quartile they fall into, measured by each of four economic parameters. Three points are awarded for being in the top quartile (of four), down to zero points in the fourth quartile. Unsurprisingly, Germany does well as Europe’s ‘engine room’; the ‘PIGS’ languish at the bottom.
What is perhaps more surprising is that relatively modest countries like Austria and Norway are in the lead, Scandinavia puts other areas to shame and the supposed “Arc of Insolvency” countries are doing better then Britain. While it would be foolish to use such measures alone to run a country, as a ‘back-of-the-envelope’ snapshot, it’s pretty solid. Little wonder that the UK is on the verge of losing its ‘AAA’ rating when it falls into the third quartile by all four measures.
It is not being a small-minded Scrooge to say that Britain cannot afford to spend money the way it is doing, especially on long-term commitments that show no return on investment—like the scale of welfare in which we now indulge. Were the economic basis on which it was built sound (like most of Scandinavia), it might be a sensible, as well as a humane, choice.
But since British welfare has been funded for decades by exploiting a variety of sources from North Sea oil profits to Irn Broon’s early raid on the pension funds, we are living beyond our means on a titanic scale. This is illustrated by a chart from the Guardian that illustrates why we are in deeper financial trouble than we have ever been; we simply cannot afford the benefits to which we have grown accustomed.
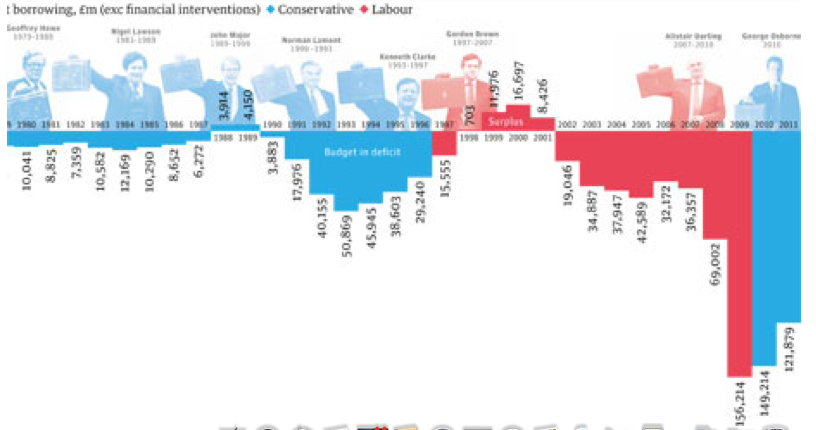
Chart 3—UK Government Net Cash Flow by Year
The financial shakiness of Tory tenure under Lawson in the eighties and Clarke’s in the nineties did pay off with eventual surpluses. But what Brown and Darling got us into in the noughties is on a scale that boggles the mind as well as the banks.
It may be against our good nature and humane compassion but the bottom line is: Britain is broke. Borrowing one pound in five cannot be sustained. Education, seen as a vital and basic right, has seen no growth in its share of spending. Defence is seen as less vital but its share has already slumped from 20% to 6.5%. Everyone agrees the NHS is sacrosanct, so, even its doubling from 9% to 18% is seen as acceptable. Everything else the government does (transport, treasury, foreign office, etc) has also been clipped—down from 41% to 28%.
That leaves the £225,000,000,000 we spend on Welfare and Pensions. You can blame Scrooge and his calculations for such a Hobson’s choice if you like but the bottom line is one of:
- we act decisively to curb this
- we butcher a different sacred cow (e.g. NHS)
- we go bust
Scrooge sez: you choose

No real choice is there, although decisively is not generally a word popular with politicians of any party. Governments are not unlike families, you cannot indefinately spend more than you earn.
I would have gone further with a 5% reduction on all benefits, with the exception of pensions (largely contributable) and a properly administered disability allowance, with a similar reduction on an annual basis. Tinkering with child benefit seems to be a financial and administrative disaster in the making. If people decide to have children, why should they expect other people to pay for them. Benefits were intended as a “safety net”, now they are a trampoline — the more benefits you get, the higher you can bounce. How many benefits are there ?????? People are paying out money in taxes, to get money back in benefits. Is this crazy. It’s almost where to start, it makes the Gordonian Knot look simplistic. So a bit of belt tightening needed. Cut back on the Sky channels, mobile upgrades etc.
JTF